

Florence Nightingale’s famour polar area or rose diagram (also known as coxcomb) has been well studied through history. We asked our followers to create their interpretation of these popular plots in any media or software they wished and these are the fantastic results from the #FloViz challenge.
We would like to highlight the collaborative spirit and discussion that has been created by the participants during the past 9 days, where code has been provided, feedback has been shared and mutual support has been shown. Please check the hashtag #FloViz to follow these fascinating #dataviz conversations.
Adult entries
In order of submission the adult entries to the challenge are:
1
Reproduction of the coxcombs in R, by Edward Gunning (University of Limerick)
Code and additional info: https://github.com/edwardgunning/FlorenceNightingale
2
Reproduction of second set of coxcombs representing Manchester mortality in R, by Edward Gunning (University of Limerick)
Code and additional info: https://github.com/edwardgunning/FlorenceNightingale
Edward has summarised his two entries in the form of an infographic:
3
Animated coxcomb showing overlapping sectors in R, by Dan Miller
4
Stacked bar chart showing mortality by cause for British soldiers in the Crimean War in R, by Will Ball (Edinburgh Napier University)
Code: https://github.com/will-ball/FloViz
5
Facetted bar chart in R by Will Ball (Edinburgh Napier University)
Code: https://github.com/will-ball/FloViz
6
Facetted bar chart with free scales in R, by David Henderson (Edinburgh Napier University)
Code: https://github.com/davidhen/floviz/blob/master/floviz.md
7
Simplified bar chart version in R, by David Henderson (Edinburgh Napier University)
Code: https://github.com/davidhen/floviz/blob/master/floviz.md
8
Animated visualisation of the annual rate of deaths attributed to preventable infection in R, by Sian Bladon (University of Manchester).
9
Animated comparison of monthly mortality rate over time by cause of dealth and estimated army size in R, by Graham Wheeler (University College London).
Code: https://github.com/graham-wheeler/FloViz
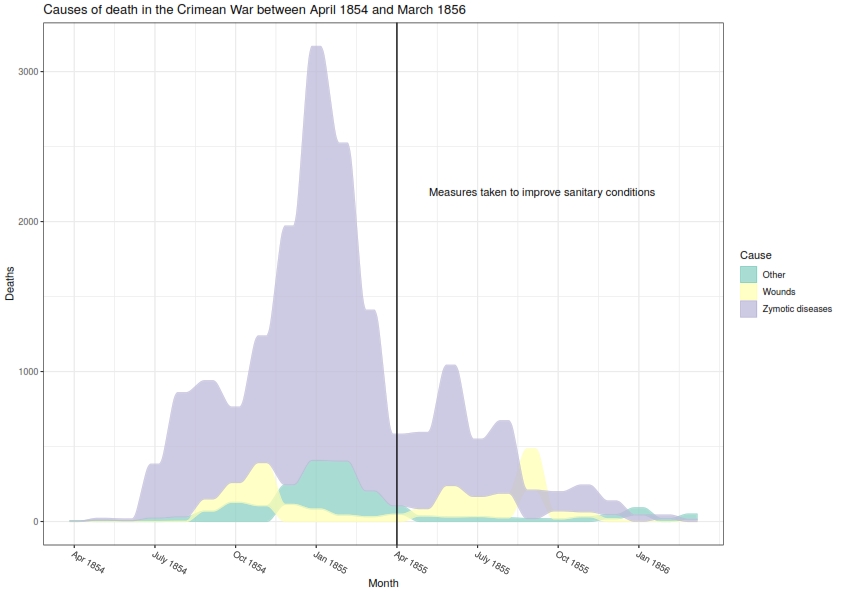
10
Area plot of deaths by causes, by James Jackson
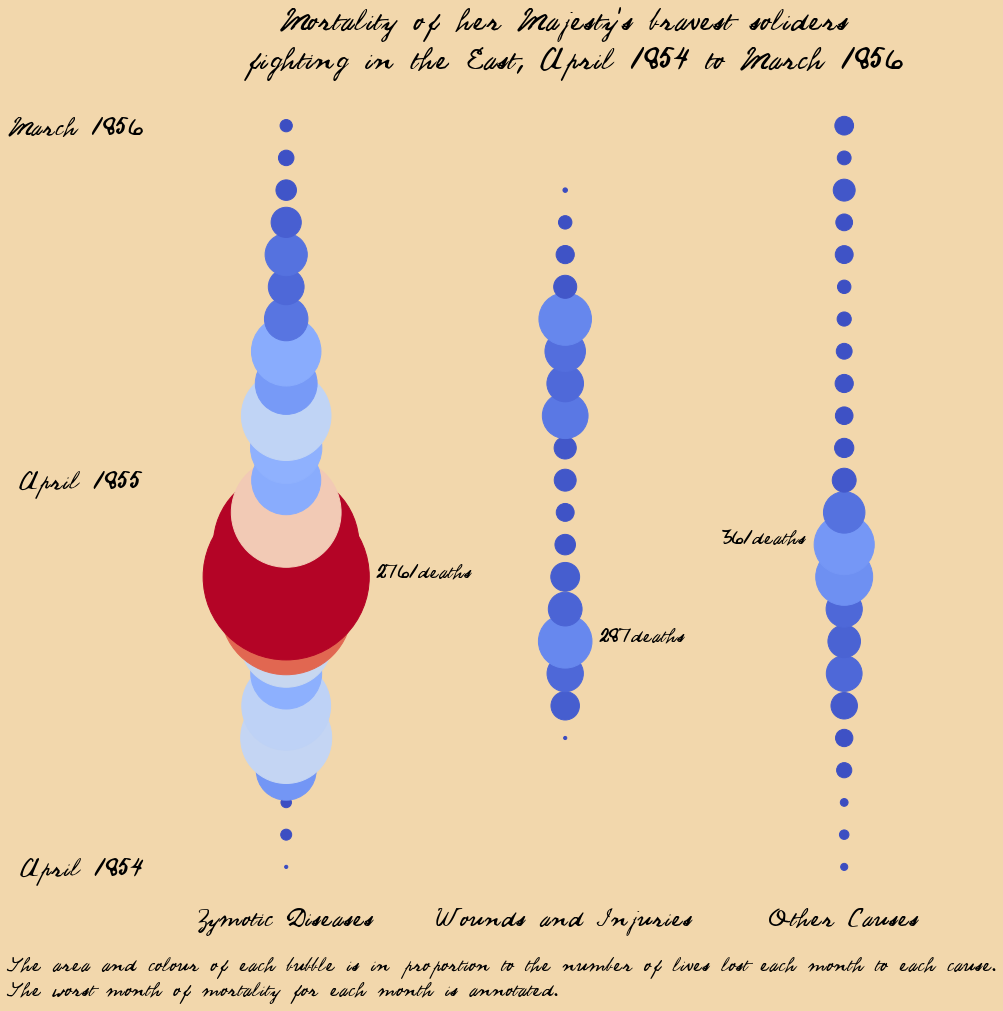
11
Mortality bubbleplot in Jupyter, by Roddy Jaques
Code: https://github.com/RoddyJaques/RSSFlorenceNightingaleComp
Children entries
In order of submission the children entries to the challenge are:
1
Beautiful Florence’s pet owl Athena made with coxcomb-like shapes, by Nandita Das.
2
Impressive plots and website, by Eider Díaz de Argandoña.
We’ll announce the winners of the prizes tomorrow 12th May 2020 at noon (GMT+1).
The three winning prizes in each category will win one of these amazing badges designed by Heidi Gardner (Science on a Postcard).

Just for fun
In order to get the challenge started, we produced some fun reinterpretations, see below!
We even got our own hex sticker! Thanks to Edward Gunning for coding this!
Let’s continue celebrating Florence Nightingale pioneering work by keeping the hashtag #FloViz alive. Please continue tweeting your visualisations and we’ll circulate them. Who knows, there might even be some sparee badges 😉

